Learn Profiling: XSLT/XQuery Profiling Video Demonstration
Learn how to evaluate the performance of your XQuery and XSLT using <%=ConfigurationManager.AppSettings["SS"]%>'s Profiler (shown below; click to enlarge). The Profiler Report provides a wealth of performance data in an easy-to-read tabular format. You control the level at which report data is collected, and you can customize the report's look and feel or save the raw data for your own reporting purposes if you prefer. Using <%=ConfigurationManager.AppSettings["SS"]%>'s scenario feature, you can easily see how your code responds to different processors. And the Profiler Report is Backmapping enabled! See a piece of performance data that just doesn't compute? Just click the data in question, and <%=ConfigurationManager.AppSettings["SS"]%> places a pointer on the line of code that generated it. Play this video demonstration and see how <%=ConfigurationManager.AppSettings["SS"]%>'s XSLT and XQuery Profilers can speed XSLT and XQuery development and result in higher-performing, optimized code!
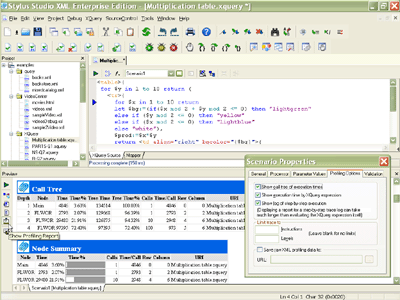
Using the XSLT and XQuery Profilers covers:
- Setting Profiler options to record performance metrics based on
- Call tree execution times
- Execution times by element
- Step-by-step element execution
- Running the Profiler — just click a button!
- Displaying benchmark statistics in the Profiler Report — time to complete a given operation, percent of total time for that operation, number of calls, average time per call, and so on
- Backmapping from discrete performance data to the line of XSLT or XQuery that generated it
- Using Profiler performance metrics to troubleshoot and fine-tune
your XSLT and XQuery — just make a change, Preview the results, and display the report; it's that easy - Evaluating how different XSLT processors affect your XSLT's performance metrics (you can specify which of several XSLT processors, including Xalan-J, Saxon XSLT, Saxon XQuery, and MSXML, you want to use to process your XSLT)
- Customizing the Profiler Report's look and feel using the default stylesheet, or one of your own; you can even save the raw data and use it as the source for your own performance metrics calculations!