XSLT PROFILER
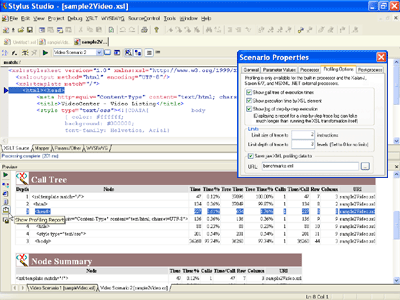
<%=ConfigurationManager.AppSettings["SS"]%>'s XSL and XSLT profiler (illustrated below — click to enlarge) allows you to create detailed XSLT performance profiles of any stylesheet in a processor-independent way. When activated, the XSLT profiler seamlessly records and logs every single XSLT instruction and processing operation, resulting in a detailed statistical profile about a particular XSL or XSLT transformation. The detailed XSLT profile provides a wealth of useful hints for XSL and XSLT stylesheet optimizations, essential for XSLT based applications that demand maximum performance. <%=ConfigurationManager.AppSettings["SS"]%>'s XSLT profiler works seamlessly with many popular XSLT processors, including Saxon 6, Saxon 7, Saxon 8, MSXML, and System.XML (Microsoft .NET XML Processing API).
For an step-by-step tutorial on how to use the XSLT profiler, watch our online video demonstration entitled: Improving XSLT and XQuery Performance with Stylus Studio, or, simply read on.
XSLT Profiling Options
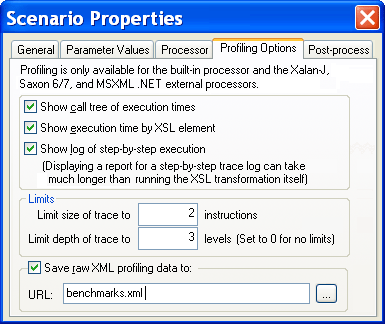
<%=ConfigurationManager.AppSettings["SS"]%>'s XSLT profiler includes a wealth of profiling options, giving you full control over every bit of information being logged. For example, you can elect to:
- Show a call tree of XSLT stylesheet execution times
- Display execution time by XSL element
- Show a log of step-by-step execution
- Limit the depth or size of an XSLT trace
- Specify the output filename
The XSLT profiler's options panel is illustrated here:

Save XSLT Profiling Report as XML or HTML
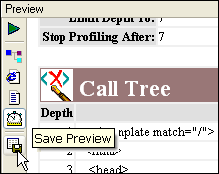
The XSLT stylesheet profile report is saved as an XML file, and by default <%=ConfigurationManager.AppSettings["SS"]%> includes an XSLT stylesheet to render the report as an HTML report which can be viewed in the built-in Preview Window. Alternatively, you could customize the XSLT profiling report simply by creating an XSLT stylesheet.

Backmapping of XSLT Profiling Results to XSLT Stylesheet Source
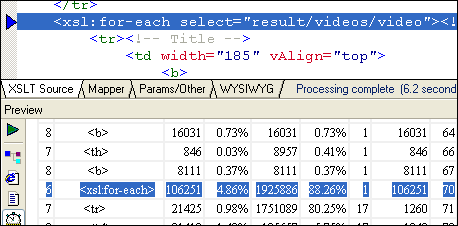
<%=ConfigurationManager.AppSettings["SS"]%>'s integrated XSLT profiling preview window supports backmapping — a powerful feature to help identify, isolate and correct potential XSLT stylesheet bottlenecks. In the illustration below, an xsl:for-each instruction has been clocked at taking up 4.86% of the total XSLT stylesheet execution time. Clicking on the xsl:for-each item in the XSLT profiling report causes <%=ConfigurationManager.AppSettings["SS"]%> to automatically highlight the corresponding line in the XSLT stylesheet source code, thus simplifying XSLT stylesheet troubleshooting development.

XSLT Profiling Support for any XSLT Processor
<%=ConfigurationManager.AppSettings["SS"]%> is the only XML IDE to provide integrated development support for all of the leading XSLT processors - this means that you can run and compare detailed XSLT stylesheet profiling reports using Microsoft MSXML, System.XML (Microsoft .NET XML Processing API), Saxon XSLT, etc. Wondering what's the fastest XSLT processor for your application? Stop guessing and see how easy it is to run your own internal benchmarks today. You'll be surprised with the results!

<%=ConfigurationManager.AppSettings["SS"]%>'s XSLT Profiler is a must-have tool for development of advanced XSLT stylesheet applications that demand maximum performance - download a free trial today!
