Home >Online Product Documentation >Table of Contents >Enabling the Profiler
Enabling the Profiler
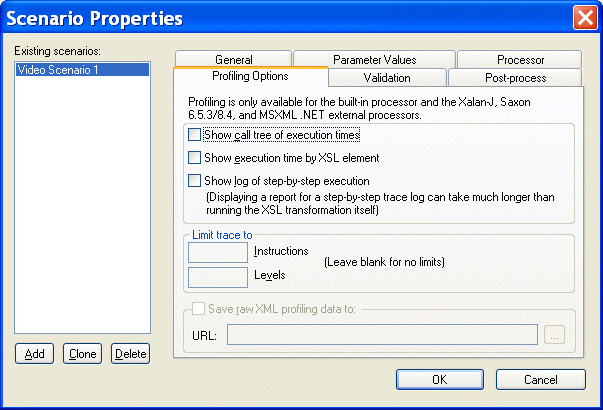
The XQuery Profiler is off by default. You enable the Profiler on the Profiling Options tab of the XSLT Scenario Properties dialog box.
To enable the XSLT Profiler:
1. Open the Scenario Properties dialog box for the XSLT stylesheet. (Click Browse at the top of the XSLT editor window.)
2. Click the Profiling Options tab.
3. Select the settings for the performance metrics you want the Profiler to capture.
4. Optionally, save the raw Profiler data to a separate file.
5. Click OK.
The next time you preview the XSLT results, the performance metrics you selected are available to you in the XSLT Profiler report (and as raw data if you selected that setting and specified a file).
