Home >Online Product Documentation >Table of Contents >Gathering Debug Information About the Sample Files
Gathering Debug Information About the Sample Files
This topic is part of a sequence that starts with Setting Up Stylus Studio to Debug Sample Files.
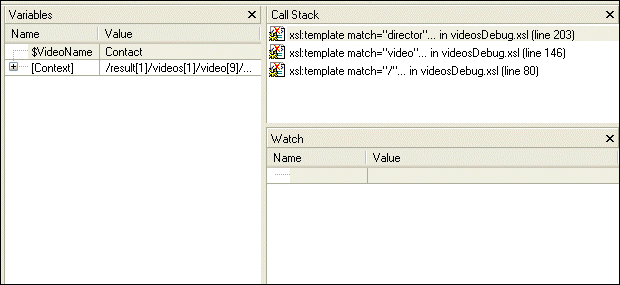
When XSLT processing is suspended at a breakpoint, Stylus Studio displays the Variables, Call Stack, and Watch windows.
You can use the information in these windows to learn about potential and actual problems encountered in your XSLT processing.
Tip
|
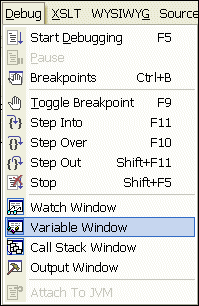
| You can also control the display of these windows using the Debug menu, shown here, or the tool bar.  |
The Variables Window
The Variables window displays a list of variables and their values when processing was suspended.
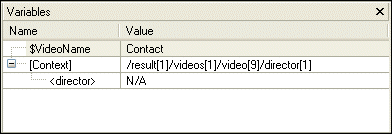
As you can see, the stylesheet defines the VideoName parameter, which had no value when processing was suspended. In addition, the Variables window shows you that when processing was suspended, the processor was operating on the first director child element of the first video child element of the first videos child element of the first result element.
The Call Stack Window
The Call Stack window displays a history of the steps the processor performed to reach the point at which processing was suspended, including the names of the templates that are currently instantiated, in most recent-to-oldest order.
In this example, the XSLT processor has instantiated the director template, which is part of the instantiation of the video template, which is part of the instantiation of the template that matches the root node.
To step out of debug, click Step out  , or press Shift+F11.
The processor completes the instantiation of the director template, which adds some HTML to the Preview window. The yellow triangle moves to show the new location in the XSLT source.
As you can see in the Call Stack window, the processor is now two levels deep in the template that matches the root node, instead of three levels deep as it was previously. The value of the context node in the Variables window is /result[1]/videos[1]/video[9] (it was /result[1]/videos[1]/video[9]/director[1]).
The Watch Window
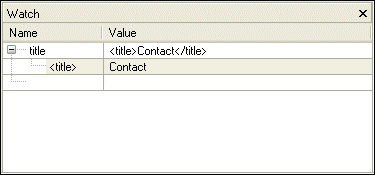
If your application contains a lot of variables, the Watch window allows you to focus on the variables in which you are particularly interested.
To enter a variable to watch:
As processing continues, the Watch window displays the values of the variables you specify.


