Home >Online Product Documentation >Table of Contents >Profiling XQuery
Profiling XQuery
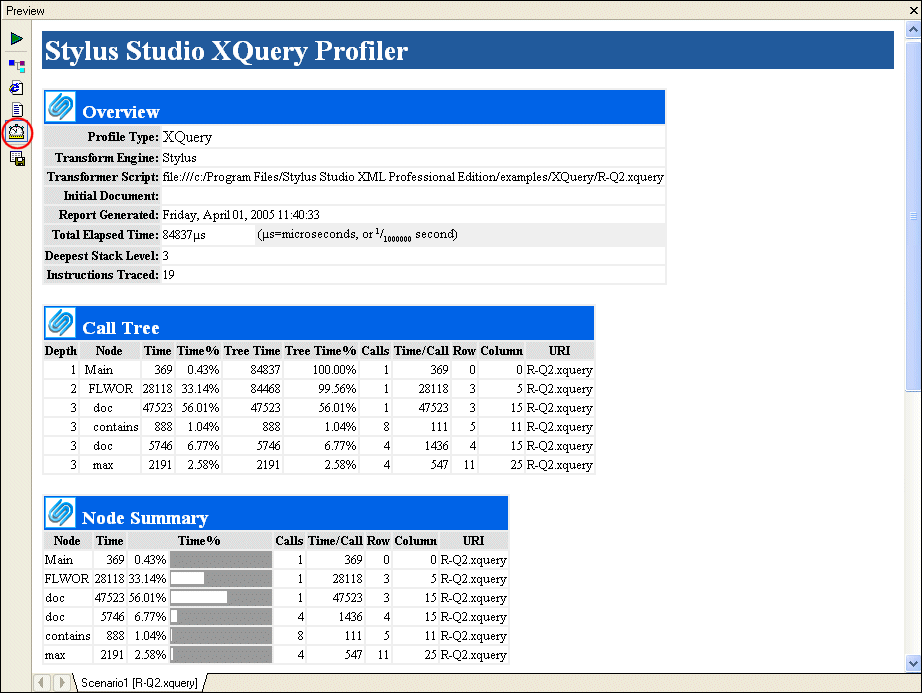
In addition to debugging tools for XQuery, Stylus Studio provides the XQuery Profiler, a tool that helps you evaluate the efficiency of your XQuery. By default, the performance metrics gathered by the XQuery Profiler are displayed in a preformatted report, like the one shown here:
The report format is controlled by the default XSLT stylesheet, profile.xsl, in the \Stylus Studio\bin directory. You can customize this stylesheet as required. You can save XQuery Profiler reports as HTML.
In addition to generating the standard XQuery Profiler report, you can save the raw data generated by the Profiler and use this data to create your own reports. See Enabling the Profiler for more information about this procedure.
| Watch it! You can view a video demonstration of this feature by clicking the television icon or by clicking this link: watch the XQuery Profiling video. |
A complete list of the videos demonstrating Stylus Studio's features is here: http://www.stylusstudio.com/xml_videos.html.
About Performance Metrics
The XQuery Profiler can record three different levels of performance metrics:
- A call tree of execution times
- Execution times by XQuery expression, and
- A detailed log of step-by-step expression execution
Enabling the Profiler
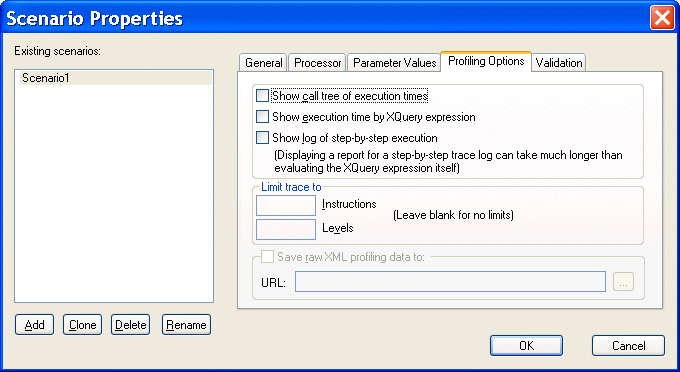
The XQuery Profiler is off by default. You enable the Profiler on the Profiling Options tab of the XQuery Scenario Properties dialog box.
To enable the XQuery Profiler:
The next time you preview the XQuery results, the performance metrics you selected are available to you in the XQuery Profiler report (and as raw data if you selected that setting and specified a file).
Displaying the XQuery Profiler Report
To display the XQuery Profiler report:
The XQuery Profiler report appears in the Preview window.

