XQuery Profiler
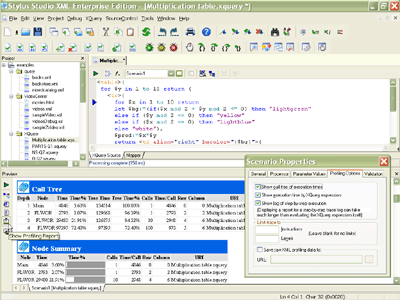
<%=ConfigurationManager.AppSettings["SS"]%>'s XQuery Profiler (illustrated below — click to enlarge) XQuery Profiler allows you to benchmark any XQuery expression, and it helps you locate and eliminate performance bottlenecks for maximum XQuery performance.. A new online video demonstrates the use of the <%=ConfigurationManager.AppSettings["SS"]%> XQuery Profiler. This tutorial covers an overview of its main features, including an example with a sample profiling report.
Generate Detailed Performance Profile of XQuery Code
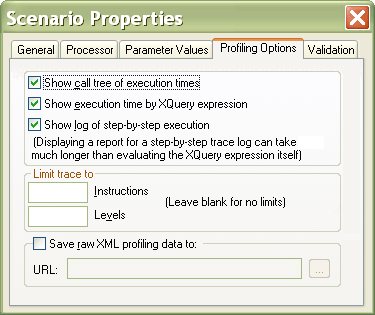
First, enable the <%=ConfigurationManager.AppSettings["SS"]%> XQuery Profiler from within the XQuery editor. Click on the scenario properties button (the "..." icon) and select the "Profiling Options" tab, as illustrated here:

You can customize various aspects of the XQuery profiling report, including the following options:
- Show call tree of XQuery execution times
- Show execution time by XQuery expression
- Show log of step-by-step XQuery functions
- Limiting the XQuery trace to a specified number of instructions
- Limiting the XQuery trace to a specified level (or depth)
- Optionally save the raw XQuery profiling data to an XML file
XQuery Performance Profiler Backmapping
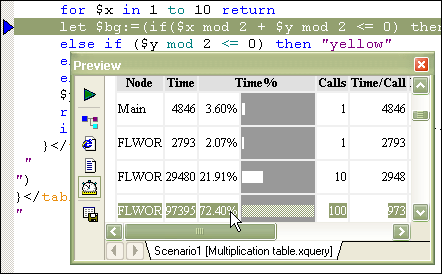
Once you've selected your XQuery profiling options, simply run your XQuery expression by pressing the "Execute XQuery" button or by typing the F5 key. A detailed XQuery performance profile is displayed in the XQuery output preview window. Backmapping is a helpful feature involving the seamless integration of of the <%=ConfigurationManager.AppSettings["SS"]%> XQuery Profiler's report, and your original XQuery source code, to help you identify and eliminate performance bottlenecks. Simply click on any line in the XQuery profiler's report, and <%=ConfigurationManager.AppSettings["SS"]%> will automatically highlight the corresponding line of XQuery code in the XQuery editing window. In the example illustrated below, <%=ConfigurationManager.AppSettings["SS"]%> has determined that 72.40% of the time taken to execute an XQuery is taken up by a single node - by clicking on the report, <%=ConfigurationManager.AppSettings["SS"]%> highlights the expensive conditional looping block inside of an XQuery FLWOR Block.

Save the XQuery Performance Analysis as HTML
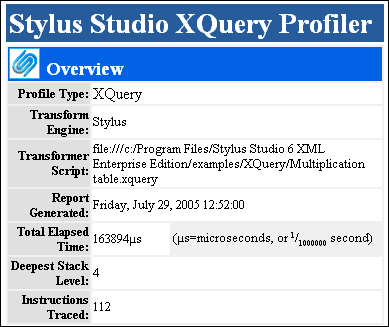
From within the XQuery Output Preview Window, click on the Save-As button to save a copy of the XQuery profiling report as HTML using the default stylesheet provided with <%=ConfigurationManager.AppSettings["SS"]%>, illustrated below. Since the performance profiling data is also available as XML, its easy to create customized report layouts.

Side-by-Side Benchmarking of Different XQuery Processors
So what if you're not using the default <%=ConfigurationManager.AppSettings["SS"]%> XQuery processor in your run-time environment? Not to worry! <%=ConfigurationManager.AppSettings["SS"]%> also supports XQuery profiling with other leading XQuery processing components, including the Java-based Saxon XQuery Processor, illustrated below. Support for multiple XQuery processors in the XQuery Profiler also alows you to create side-by-side comparison benchmarks of running the same XQuery expression using different processors, or testing modified versions of an XQuery expression against the original.

If your application has the need for speed, <%= ConfigurationManager.AppSettings["SSVXE"] %> XQuery profiler is a must-have! Profilers are important tools for analyzing XQuery performance — they providing a detailed trace of execution times, allowing you to benchmark XSLT or XQuery against different processors. This valuable insight into how to optimize the underlying XSLT or XQuery code. As XML applications become increasingly complex, <%=ConfigurationManager.AppSettings["SS"]%> XQuery profiler along with our XSLT Profiler are essential - especially if you plan to deploy XSLT or XQuery code to mission-critical systems. Stop the guesswork, or throwing money at costly hardware based XML processors and start improving XML application performance today.
